While visual inspection is probably the most reliable way of identifying anomalies in time series, things can be missed when there are large numbers of time series to inspect. In this case, it can be useful to additionally test the individual time series for certain conditions, such as the presence of missing values or for values breaching pre-set limits, and to alert the user to them.
The alert results are displayed in different ways depending on the chosen type of output. Tabs containing time series which failed at least one alert are highlighted. A separate tab containing all the alert results is added at the end.
It is also possible to just generate the alert results as a data frame.
Note: This functionality is still in the early stages of development, and can increase the document size and rendering time of the report considerably.
Overview
One or more alerting rules can be specified within an
alert_rules() object, which is then passed into the
alert_rules parameter. When creating a standard mantis
report, the alertspec parameter also controls how the
results are displayed in the final tab.
Built-in rules
There are a number of built-in rules that can be used to test for
simple conditions, the simplest of which is testing for the presence of
missing values. The extent_type and
extent_value parameters can be used to adjust the
tolerance. E.g.
# alert if all values are NA
ars <- alert_rules(alert_missing(extent_type = "all"))

# alert if there are 10 or more missing values in total
# or if the last 3 or more values are missing
# or if 5 or more values in a row are missing
ars <- alert_rules(
  alert_missing(extent_type = "any", extent_value = 10),
  alert_missing(extent_type = "last", extent_value = 3),
  alert_missing(extent_type = "consecutive", extent_value = 5)
)
The alert_equals(), alert_below(),
alert_above() rules work similarly, but with an extra
parameter rule_value to compare against. It is also
possible to compare a range of values with another range of values using
the alert_difference_above_perc() and
alert_difference_below_perc() rules. This can be useful for
checking if recent values are lower/higher than in a previous period,
over a particular percentage. This comparison is based on the mean of
values in the two periods. The ranges should be contiguous, and denote
positions from the end of the time series. E.g.
# alert if the mean of last 3 values is more than 20% higher than
# the mean of the preceding 12 values
ars <- alert_rules(
  alert_difference_above_perc(
    current_period = 1:3,
    previous_period = 4:15,
    rule_value = 20
  )
)
Custom rules
If you want to apply a more complex rule, you can specify your own
using alert_custom(). E.g.
ars <- alert_rules(
  alert_custom(
    short_name = "my_rule_combo",
    description = "Over 3 missing values and max value is > 10",
    expression = quote(
      sum(is.na(value)) > 3 && max(value, na.rm = TRUE) > 10
    )
  ),
  alert_custom(
    short_name = "my_rule_doubled",
    description = "Last value is over double the first value",
    expression = quote(
      rev(value)[1] > 2 * value[1]
    )
  )
)
The expression is evaluated per time series, and must
return either TRUE or FALSE. A return value of
TRUE means the alert result is “FAIL”
Column names that can be used explicitly in the expression are
value and timepoint, and which refer to the
values in the value_col and timepoint_col
columns of the data respectively. Before evaluating the
expression, the dataframe is grouped by the
item_col and ordered by the timepoint_col.
Applying different rules to different time series
By default, the specified rules will be run on all time series in the
supplied dataframe. You can specify different sets of rules for
different time series by using the items parameter, and
providing it a named list of character vectors corresponding to the
item_cols columns and values that the particular rule
should be applied to.
Walkthrough
Generate an interactive mantis report for the
example_prescription_numbers dataset supplied with the
mantis package.
mantis_report(
df = example_prescription_numbers,
file = "example_prescription_numbers_interactive.html",
inputspec = inputspec(
timepoint_col = "PrescriptionDate",
item_cols = c("Antibiotic", "Spectrum", "Location"),
value_col = "NumberOfPrescriptions",
tab_col = "Location"
),
outputspec = outputspec_interactive(
sync_axis_range = FALSE
),
report_title = "mantis report",
dataset_description = "Antibiotic prescriptions by site",
show_progress = TRUE
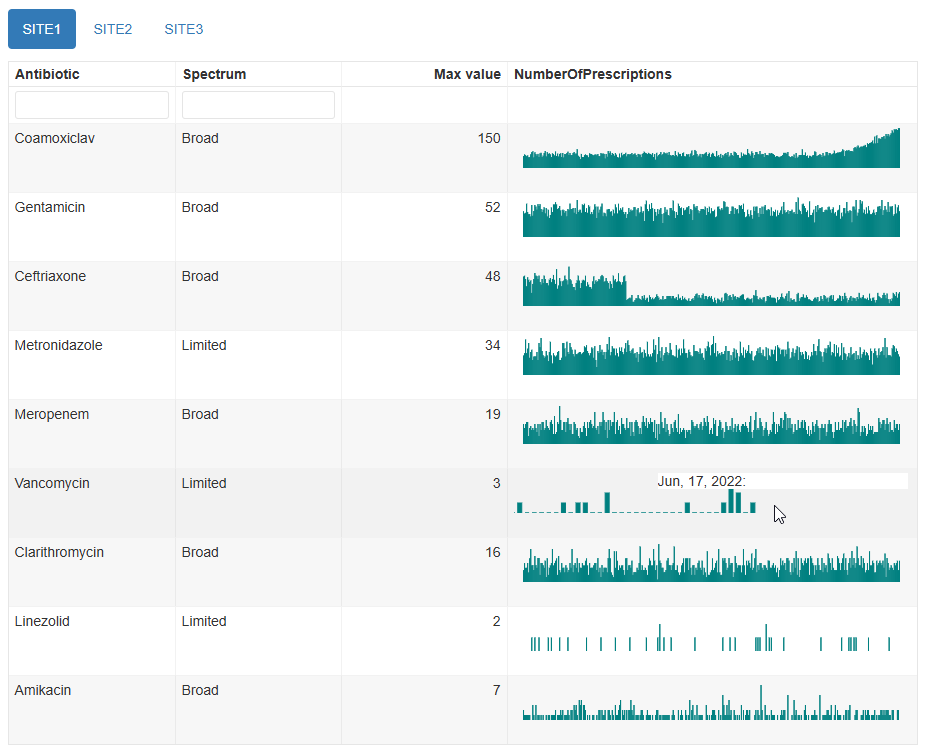
)In the SITE1 tab, the Vancomycin time series contains a block of NA values but it is not easy to distinguish between NA values and zero values unless you zoom in on the plot (by selecting a section of it with the mouse) or hover the mouse over the relevant time points and read the tooltips.
We can easily add a rule to test for any missing values. While we’re here, we will also add a custom rule to try to catch the fact that Coamoxiclav prescriptions have become much higher than they were at the start.
ars <- alert_rules(
alert_missing(extent_type = "any", extent_value = 1),
alert_custom(
short_name = "my_rule_doubled",
description = "Last 7 values are over double the first 7 values",
expression = quote(
mean(rev(value)[1:7], na.rm = TRUE) > 2 * (mean(value[1:7], na.rm = TRUE))
)
)
)
# create a new report
mantis_report(
df = example_prescription_numbers,
file = "example_prescription_numbers_interactive_alerts.html",
inputspec = inputspec(
timepoint_col = "PrescriptionDate",
item_cols = c("Antibiotic", "Spectrum", "Location"),
value_col = "NumberOfPrescriptions",
tab_col = "Location"
),
outputspec = outputspec_interactive(
sync_axis_range = FALSE
),
alertspec = alertspec(
alert_rules = ars,
show_tab_results = c("FAIL", "NA")
),
report_title = "mantis report with alerts",
dataset_description = "Antibiotic prescriptions by site",
show_progress = TRUE
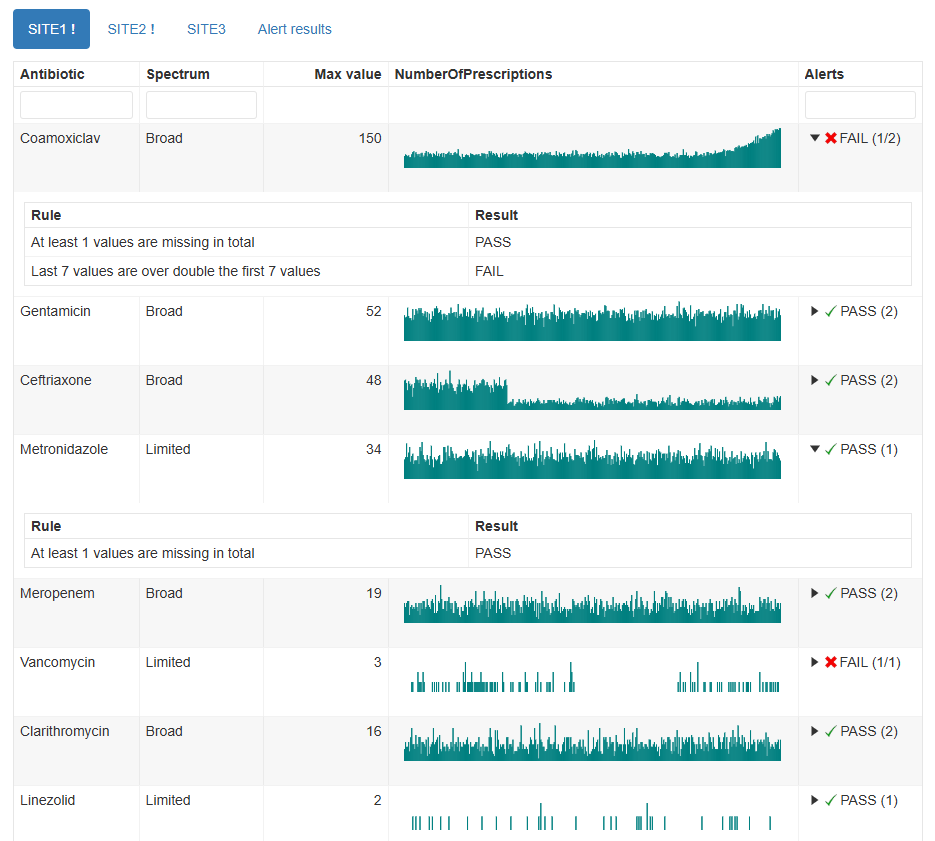
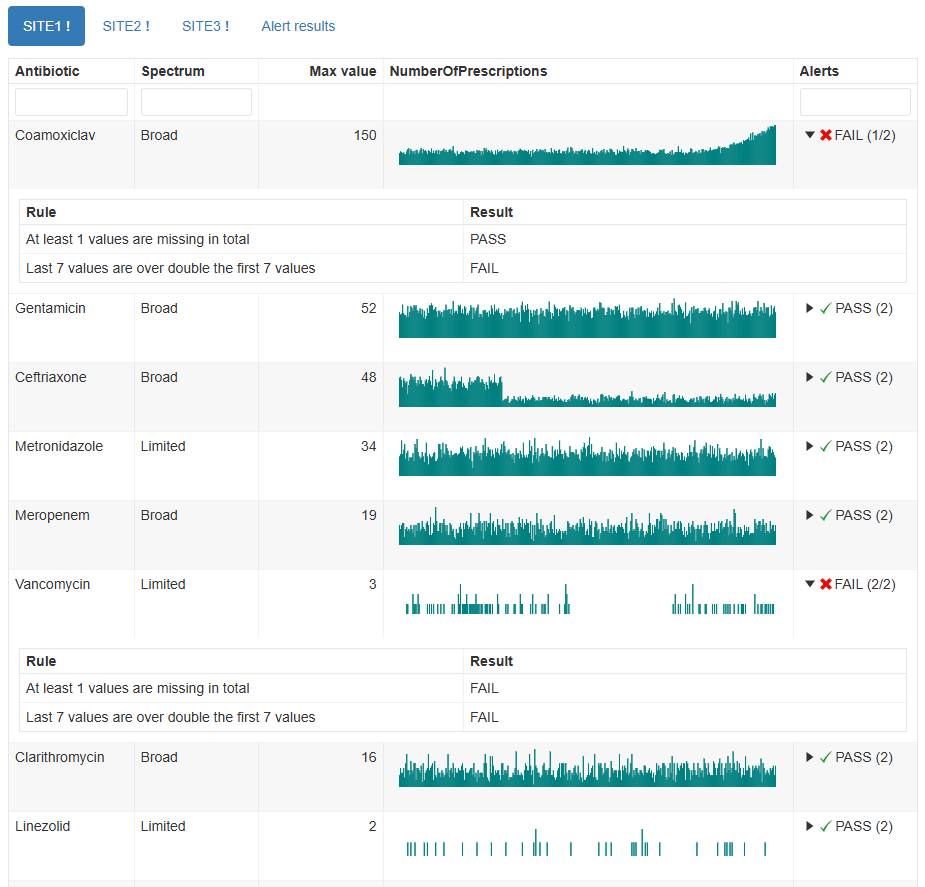
)The report now includes a column for the alert results, and details can be seen by clicking on the triangles. The tab labels will include an exclamation mark if any items in that tab have failed an alert rule.
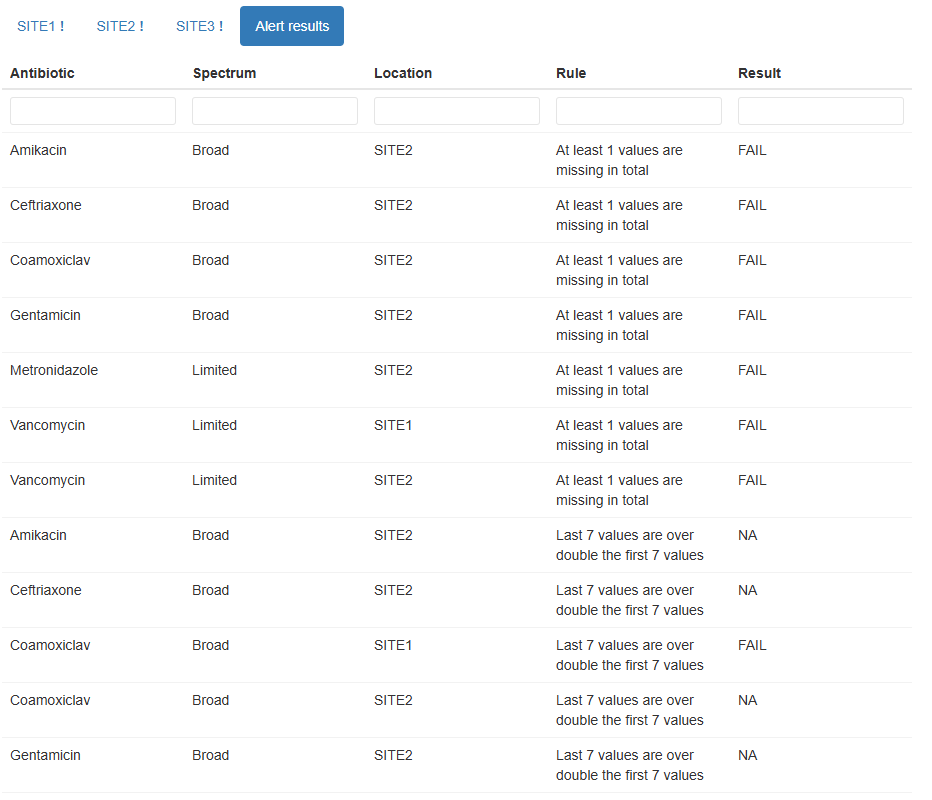
An additional tab is also created, which lists the alert results. In this example we have decided to exclude any alerts that have passed.
If for some reason we only wanted to apply the custom rule to broad
spectrum antibiotics, we can indicate this using the items
parameter of the rule.
ars_restricted <- alert_rules(
  alert_missing(extent_type = "any", extent_value = 1),
  alert_custom(
    short_name = "my_rule_doubled",
    description = "Last 7 values are over double the first 7 values",
    expression = quote(
      mean(rev(value)[1:7], na.rm = TRUE) > 2 * (mean(value[1:7], na.rm = TRUE))
    ),
    items = list("Spectrum" = c("Broad"))
  )
)

# create a new report
mantis_report(
  df = example_prescription_numbers,
  file = "example_prescription_numbers_interactive_alerts_restricted.html",
  inputspec = inputspec(
    timepoint_col = "PrescriptionDate",
    item_cols = c("Antibiotic", "Spectrum", "Location"),
    value_col = "NumberOfPrescriptions",
    tab_col = "Location"
  ),
  outputspec = outputspec_interactive(
    sync_axis_range = FALSE
  ),
  alertspec = alertspec(
    alert_rules = ars_restricted
  ),
  report_title = "mantis report with alerts - restricted",
  dataset_description = "Antibiotic prescriptions by site",
  show_progress = TRUE
)
The report now shows two rules for Coamoxiclav and one rule for Metronidazole.